Why data quality is so important – and how you can improve yours
Data Solutions Designer Kanaga Selvi Nachiyar explains how we measure data quality and help organisations improve their data practices.

We’re continuing our Meet the Team series, taking you on a tour of all the different roles and disciplines that you can find across our 120-strong crew of software, data, and business experts.
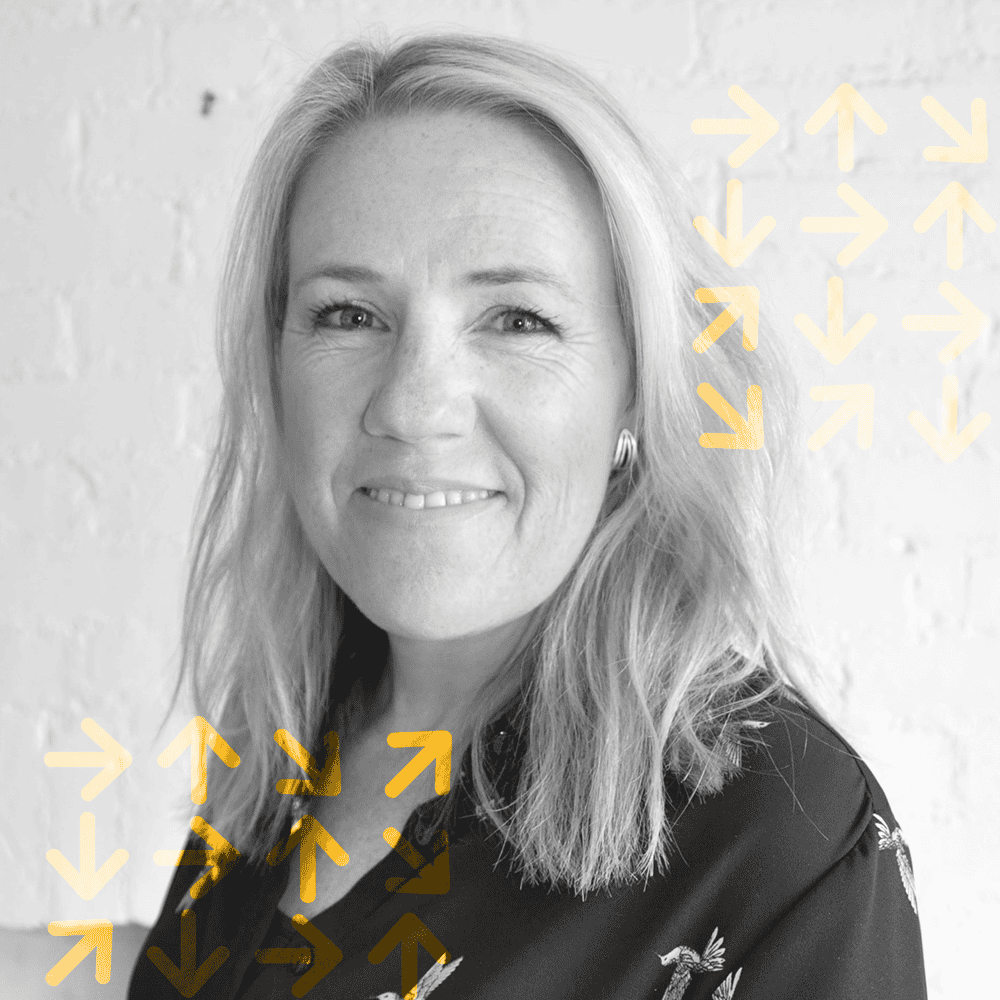
We’ve already spoken to Dynamics Developer Mike Thomas, Software Developer Akhila Rao, and more, and today we’re exploring a totally different side of development: business intelligence and reporting. Louise Patch, part of our Cornwall Council team, discusses creativity in data visualization – and why it’s so important.
Data visualisation that really tells a story
In her role with Cornwall Council, Louise is often presented with visuals that don’t tell a compelling data story, which poses both a significant business risk and reduces the opportunity for growth via insight.
Data underpins almost every decision made within an organisation, whether it’s a business or a local authority. And that means it’s vital to present that data – and the conclusions drawn from it – in a clear, compelling way.
“People don’t usually want to read lengthy reports. Getting the key message across quickly and helping people visualise the intelligence easily is really important,” says Louise.
But sometimes that’s easier said than done.
“When you develop a report, you start with a blank canvas where you can present almost anything,” explains Louise. “In big organisations, that means there’s often a lack of consistency across reports from different teams, both visually and in terms of quality.”
So, in her work with the council, Louise focuses on shaping best practice reporting across the organisation as part of the data literacy programme – and teaching its teams to make the most of Microsoft Power BI, the authority’s interactive data visualisation tool.
“I’ve created templates to help encourage self-service reporting, and right now I’m working on accessibility guidelines to help ensure all our reports are available and understandable for everyone” says Louise.
It’s often hard to get people to engage with data, so it’s really important we put in the work to ensure reports are clear and compelling.

Finding creativity in data
Louise’s interest building insightful visualisations stems from her love of technology and creativity, which originally led to studying for a degree that included both computing and computer-aided design. “I was torn between becoming a programmer and an architect. But development was a much simpler career path to follow, and there’s a lot of variety in the jobs available,” she explains.
After five years at BAE Systems in data analysis, Louise joined engineering consultancy BuroHappold for 17 years. She worked in various developer roles before moving towards business intelligence projects, creating a data warehouse and exploring the most effective ways to create reports. She then moved to the University of Bristol to continue report development on a large-scale integration project.
“I realised it’s possible to be really creative with data,” says Louise. “In a great report, you can get the message across without any ambiguity; everything is designed with the user experience in mind.”
Louise recently attained Microsoft certification in Data Analysis in Power BI, and creates effective reports by combining that skill with inspiration from sources like Information is Beautiful, a data visualisation project by designer David McCandless that’s all about clear, aesthetically pleasing infographics. “I take ideas for formats and layout from everywhere – marketing material, magazines, mobile apps. Information is Beautiful reports are often impossible to imitate in a work environment when you’ve got a tight deadline, but it’s good to have something to aspire to!”
Explore the Headforwards culture
There’s more to come in this series, so keep an eye out for the next instalment. And if reading the stories from our team has piqued your interest in working with Headforwards, you can learn more about what it’s like to work here on our Careers page.
Headforwards™ is a Registered Trade Mark of Headforwards Solutions Ltd.
Registered Address: FibreHub, Trevenson Lane, Pool, Redruth, Cornwall, TR15 3GF, UK
Registered in England and Wales: 07576641 | VAT Registration Number: GB111315770